
This section contains excerpts from my  dissertation.
Motivation
For dynamic PET images, multiple 3-D datasets exist, each covering different time periods of the complete acquisition, the so-called frames. Due to the lengthy (in the case of FET-PET up to 50 minutes) acquisition and the fact that for PET, as opposed to e.g. radiotherapy, the heads of the patients are not completely fixed, the occurrence of patient motion is probable. In fact, patient motion was noticeable in ~90% of our datasets (for an example, see Figure 1).
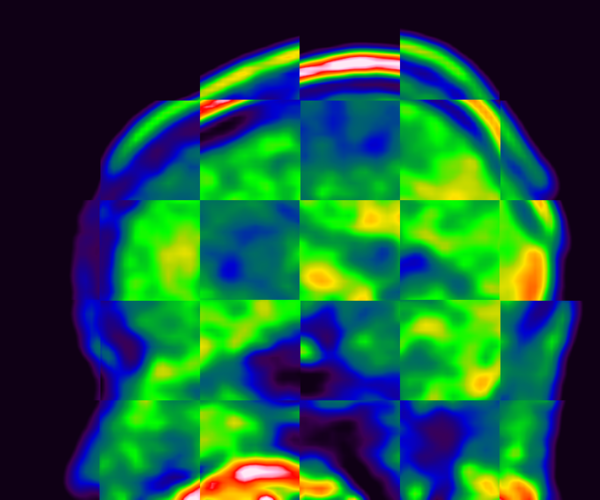
Figure 1: Checkerboard of 8th and 12th frame of a dynamic PET dataset of one patient. The noticeable misalignment is the result of motion that occurred in between the respective frames. Please note that the difference in intensities is partially due to the kinetics of the radioactive tracer and not due the patient motion.
Methods
In order to partially compensate the motion, we applied an automatic registration technique (2). The reconstructed 3-D PET datasets were registered as a preprocessing step for feature extraction. The registration was of rigid manner and relied on the mutual information as a measure for goodness of fit. In a first step we evaluated two different strategies for the motion correction.
The first approach (Figure 2) employed a reference dataset which was kept constant: In our setting, the last frame of the $N$ frames was picked as the reference frame. All other $N-1$ frames were then registered to this reference frame.
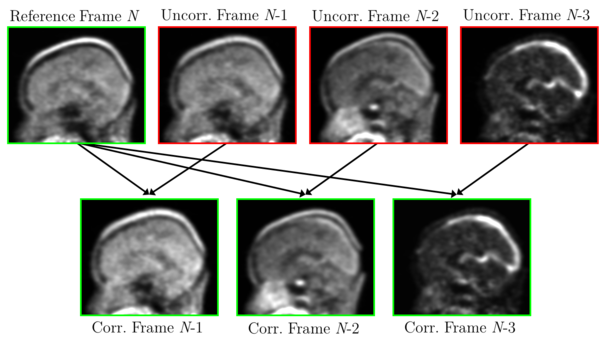
Figure 2: Illustration of motion correction incorporating a fixed reference frame.
The second approach employed a recursive technique. Its schematic can be found in Figure 3.
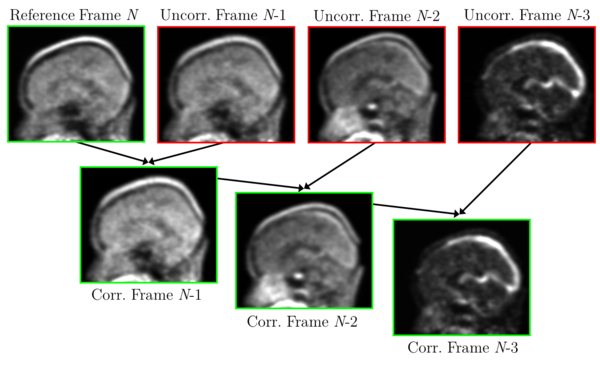
Figure 3: Illustration of PET motion correction using a recursive reference frame. The reference frame changes after each single registration.
First, frame $N$ was picked as reference and frame $(N-1)$ was registered to it. By resampling with the registration matrix, a new corrected frame $(N-1)$ is calculated. The frame $(N-1)$ was the new reference to which the frame $(N-2)$ was then registered. This was repeated until all frames were corrected.
The recursive method provided better visual results (see Figure 4).
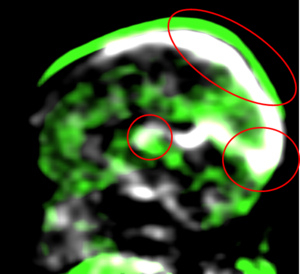
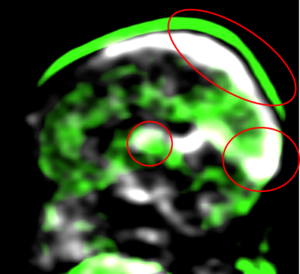
Figure 4: Side by side comparison of fused images (first and last frame) of motion correction with (left) fixed reference frame and (right) recursive reference frame for the same patient. White depicts the first frame, green the last frame. The amount of matching is better for the recursive method in the areas indicated by the small red ellipses. In the area indicated by the big red ellipse, two different structures can be seen: In white, the cranial sinus, a venous blood vessel is the prevailing structure. In green, the scalp on top of the skull is the most prominent structure. These two structures are separated among others by the skull, the meninges (membrane of the brain), and liquor. The method with the fixed reference frame aligns the two structures too closely together, the recursive method yields results which are anatomically correct.
This might be due to the fact that the intensity distribution changed over the acquired time period, even in the absence of patient motion. Thus, neighboring frames were more similar to each other than other arbitrary combinations as in the approach with a fixed reference frame.
Therefore, we chose the recursive reference method for all of the further motion corrections. An example of the achieved correction is given in Figure 5, where one finds a significantly better match between the 8th and 12th frames of the dynamic PET when compared to Figure 1.
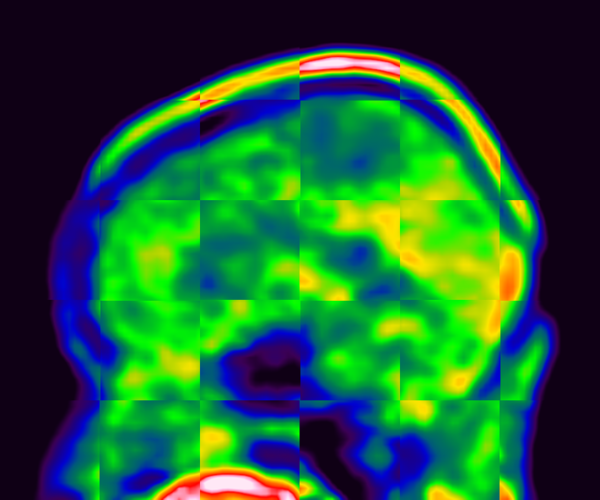
Figure 5: Checkerboard of 8th and 12th frame of a dynamic PET dataset after registration. When compared to the uncorrected Figure 1, the amount of misalignment is significantly reduced.
For evaluating the efficacy of our motion correction method, we chose a random subset of 27 patients out of our patient collective. In a blinded experiment, one experienced nuclear medicine reader was presented with either an uncorrected or a corrected dynamic PET image. The reader rated the amount of patient motion in the image on a subjective scale with grades ranging from 0 to 3. Grade 0 implied no visible motion, grade 3 heavy motion.
Results
A Wilcoxon signed-rank test (two-sided) (1) revealed significant differences between the grading of corrected and uncorrected images (p<0.05). The corrected images received lower ranks, thus indicating that the rated amount of motion is lower in those images. In another experiment, the image pairs were analyzed retrospectively in side-by-side view in order to determine, if a) the motion correction reduces the amount of motion, b) does not change the amount of motion or c) introduces more motion. In 59% (16 cases), the amount of motion was reduced; in 22% (6 cases) the amount of motion stayed the same; however, in 19% (5 cases) the motion correction introduced artifacts that increased the subjective amount of motion (Figure 6).
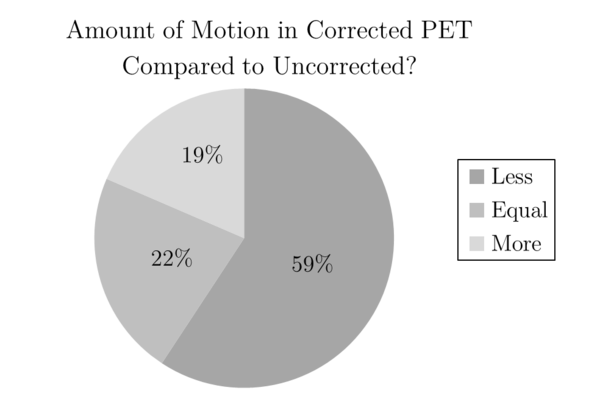
Figure 6: Pie chart for the results of the PET motion correction. We found that motion correction significantly reduces the amount of motion in the PET images. However, in some cases, weak "wiggling" is introduced by the correction and the amount of perceived motion is slightly increased.
References
- Sheskin, David J. Handbook of parametric and nonparametric statistical procedures. crc Press, 2003.
- Hahn, Dieter A., Volker Daum, and Joachim Hornegger. "Automatic parameter selection for multimodal image registration." Medical Imaging, IEEE Transactions on 29.5 (2010): 1140-1155.