


Spectral Absorption
Monochromatic Absorption
Many standard reconstruction algorithms assume that X-ray absorption behaves more or less monochromatic, i.e. all X-ray photons have the same energy. If this were the case, the observed intensity $I $ could be modeled as:
$$I=I_0e^{-\sum_i\mu_il_i}$$
where $I_0$ is the intensity emitted at the source, $\mu_i$ the material attenuation coefficient, and $l_i$ the intersection length.
This constraint allows us to compute the line integral $q_{mono}$ at each detector pixel:
$$q_{mono}=\sum_i\mu_il_i=-ln\frac{I}{I_0}$$
Based on this observation, one is able to derive a closed form solution (the radon inversion) to reconstruct the attenuation coefficients $\mu_i$. Unfortunately, this is not the case for most real X-ray applications.
Polychromatic Absorption
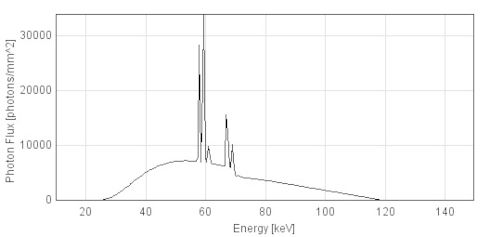 |
Most medical X-ray sources have a polychromatic X-ray spectrum. This means, that the photons that are generated have multiple photon energies. The highest energy that can appear in such a spectrum is determined by the acceleration voltage $U_a$, or peak voltage. If one electron that hits the anode is completely converted into light, its energy will be $E_{max}=U_a \cdot e^{-}$ where $e^{-}$ is the elementary charge. The image on the right shows an example of an X-ray spectrum with 120 kVp, i.e. $U_a=120kV$.
In our case, the spectrum is modeled consisting of bins. Each bin $j$ has an intensity $I_j$ which is equal to the area under the spectrum that is covered by the respective bin. Furthermore, each absorption value $\mu_{ij}$, is also modeled dependent on the energy bin $j$. These definitions enable us to find a polychromatic absorption model as
$$I_{poly} = \sum_j I_j e^{-\sum_i \mu_{ij} l_i}.$$
The total intensity of the spectrum is defined as $I=\sum_j I_j$. This allows us to compute a quantity $q_{poly}$ which is similar to the monochromatic line integral:
$$q_{poly} = -ln(I_{poly}/I) = -ln\left(\frac{\sum_j I_j e^{-\sum_i \mu_{ij} l_i}}{\sum_j I_j}\right)$$
Absorption Modeling in CONRAD
 |
In order to investigate absorption, we need to create an instance of a X-ray spectrum first. This is done by instantiating an instance of PolychromaticXRaySpectrum:
PolychromaticXRaySpectrum spectrum = new PolychromaticXRaySpectrum(min, max, delta, peakVoltage, timeCurrentProduct);
Next, we create an instance of a monochromatic absorption model. Here, we chose the average energy of the spectrum as energy of the monochromatic process:
SelectableEnergyMonochromaticAbsorptionModel monochromaticAbsorptionModel = new SelectableEnergyMonochromaticAbsorptionModel();
monochromaticAbsorptionModel.configure(spectrum.getAveragePhotonEnergy());
Furthermore, we require an instance of a polychromatic absorption model:
PolychromaticAbsorptionModel polychromaticAbsorptionModel = new PolychromaticAbsorptionModel();
polychromaticAbsorptionModel.setInputSpectrum(spectrum);
polychromaticAbsorptionModel.configure();
Now, we want to evaluate the absorption models several times. The model is evaluated given a list of intersection lengths with different materials. This is modeled as a list of PhysicalObjects. As we only want to investigate water, we only require a list with a single object:
PhysicalObject segment = new PhysicalObject();
segment.setMaterial(MaterialsDB.getMaterial("water"));
segment.setNameString("Water Path");
ArrayList<PhysicalObject> segments = new ArrayList<PhysicalObject>();
segments.add(segment);
This segment can now be used to sample different path lengths using our absorption models:
for (int i = 0; i < vals; i++){
double length = i*20;
Edge edge = new Edge(new PointND(0), new PointND(length));
segment.setShape(edge);
monochromaticAbsorptionModel.evaluateLineIntegral(segments);
polychromaticAbsorptionModel.evaluateLineIntegrl(segments);
}
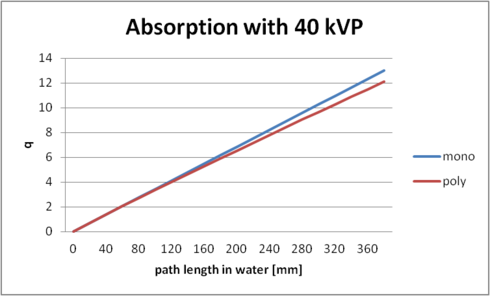
The final code for the data generation of the image on the right can be reviewed in package edu.stanford.rsl.tutorial.physics in class SpectralAbsorption.