
Contact
 +49 9131 85 27891
 +49 9131 85 27270

Address
Chair of Computer Science 5 (Pattern Recognition)
Martensstrasse 3
91058 Erlangen
Germany
Powered by


Dipl.-Inf. Johannes Jordan
Alumnus of the Pattern Recognition Lab of the Friedrich-Alexander-Universität Erlangen-Nürnberg
Multispectral Image Visualization
When we take an image, it is a natural desire to look at it with our eyes. However, a multispectral camera captures a wealth of information about the scene, and presenting this information visually is a challenging task.
Two common approaches to visualization of high dimensional data are
- interactive visualization, where the user can manipulate the display to explore data step-by-step,
- dimensionality reduction, where a low-dimensional representation of the most important information in the data is presented to the user.
For our multispectral image analysis framework, we research both areas to find new answers to the question of how a user can intuitively and efficiently inspect an image.
 |
 |
Existing approaches on depicting a multispectral image in its entirety are bound to the spatial layout of the image. The image data is seen as a cube, with the z-axis corresponding to image bands, which are stacked on top of each other. Use of modern volume rendering techniques can help to make this representation useful in some scenarios. However in most cases, where there is no sparsity in pixels of interest, a very cluttered view is obtained that reveals the shortcomings of a simple arrangement of high-dimensional data into a 3D scene.
Other methods, such as scatter plots or false-coloring, rely on dimensionality reduction. While the visualization of reduced data is helpful in many applications, it is hard to preserve subtle details that are of interest in applications like reflectance analysis. On the contrary, a good visualization of the original data helps the observer to judge how well a dimensionality reduction method fits a specific application.
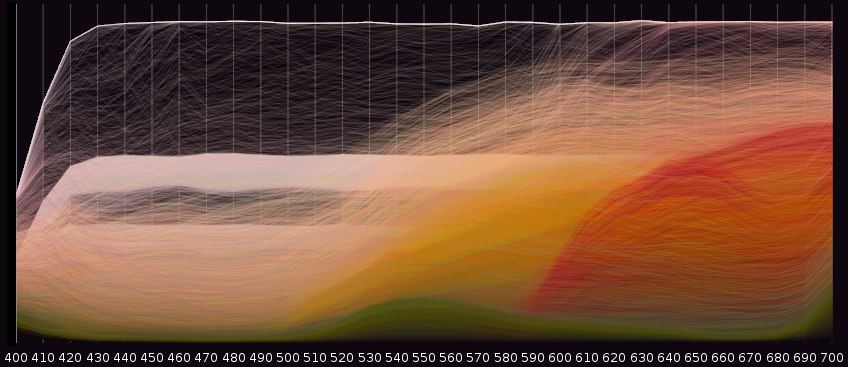
In this work, we define a new workflow in exploring a multispectral image. The user navigates through two different data representations at once. Parallel coordinates are used to visualize the spectral distribution in the image. The visualization is highly dynamic and interacts with the topological representations of the image (e.g., a grayscale depiction of a single image band). As a result, and in combination with  user-guided segmentation, the image is explored step-by-step.
The main contributions of this work are a fast, interactive parallel-coordinates representation of the scene, as well as putting this visualization into a capable user interface that fosters interactive visualization.
Publications:
 |
 |
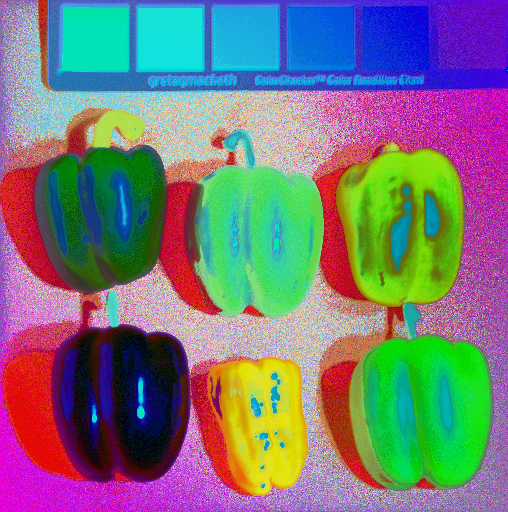 |
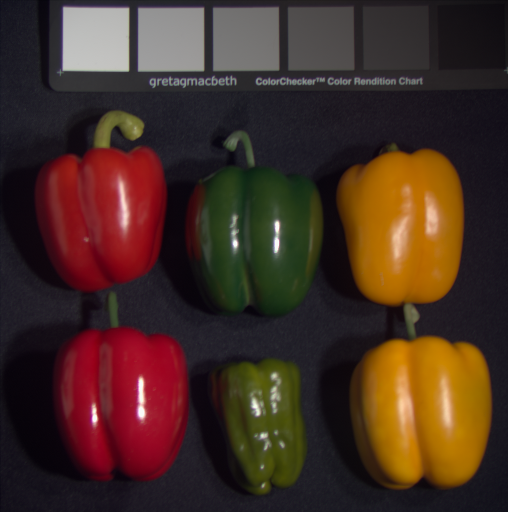
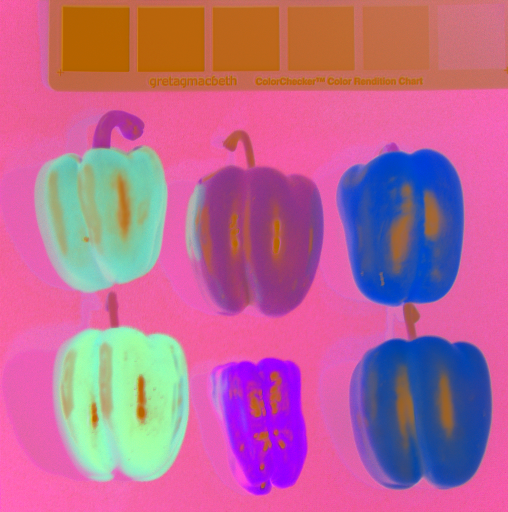
False-color visualization is a powerful component of interactive hyperspectral image analysis. In a false-color image, the user can find relevant information and distinction between data points directly in the spatial layout of the captured scene. In the example above, half of the peppers are plastic, but share colors with the organic peppers in the true-color representation.
Three categories of false coloring are very common in hyperspectral image analysis.
- Three bands from the image are selected and then mapped to R, G, B color channels.
- Dimensionality reduction on the image data as a whole is performed, leading to three bands that cover most information in the image and are mapped to R, G, B.
- Intermediate data values are computed through other means, e.g. classification of pixels. Then, a combination of classification results forms the false-color image.
We investigate a novel unsupervised technique for false coloring that belongs to the second category. It is based on the non-linear self-organizing map (SOM) dimensionality reduction. We first train a modified 3-dimensional SOM on the image data. Instead of a single answer, our SOM returns several answers to each data query. Then we employ a novel rank-based linear weighting to create a meaningful RGB representation of the query result. The result of this adaptation is a high-quality visualization that is helpful in several application scenarios.
Publications:
Jordan, Johannes; Angelopoulou, Elli. Hyperspectral Image Visualization With a 3-D Self-Organizing Map. IEEE 5th Workshop on Hyperspectral Image and Signal Processing: Evolution in Remote Sensing (WHISPERS), to appear