
Friedrich-Alexander-Universität Erlangen
Lehrstuhl für Mustererkennung
Martensstraße 3
91058 Erlangen

Quantitative glaucoma indices commonly rely on geometric parameters of the optic nerve head (ONH) such as disk area or cup volume.
However, the ONH is too complex structure to be accurately analyzed by geometric morphometry because of:
We provide dense descriptions of the ONH variability in glaucomatous cases presented by tissue deformations.
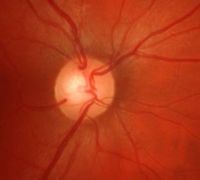
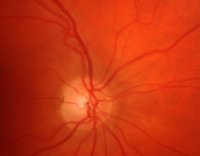
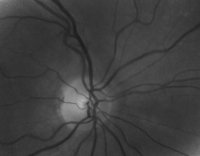
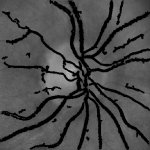
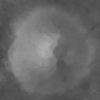
Normalized optic nerve head images by eliminating disease independent variations such as
Characterization of inter subject ONH variability by dense deformation fields calculated between one reference image and image samples
ONH reference image R that is characterized by the minimal average residual deformation over a sample set I is calculated by an iterative procedure:
to provide a mathematically derived and biologically interpretable description of ONH variability in glaucomatous optic atrophy.
→ Identification of modes most discriminating between controls and glaucomatous
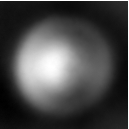
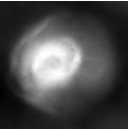
Comparison of pixel wise averaging (left) and deformation based averaging
(right) of ONH reflectance images of controls.
Pixel wise averages are too smooth to indentify local structures. Deformation based averaging clearly shows the naturally shaped appearance of the cup (central bright spot).
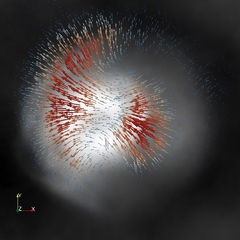
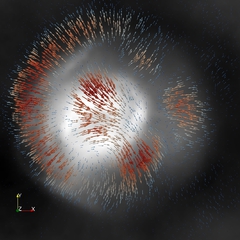
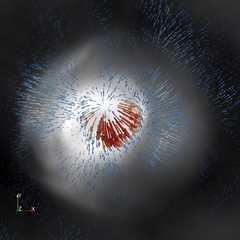
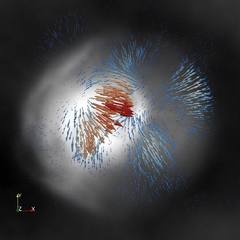
First four PCA modes most discriminating between control and glaucoma
providing a mathematically derived and biologically interpretable description of ONH deformations: (first row) Simultaneous deformation of the cup and rim, (second row) local extension of the cup (red: high magnitude, blue: low magnitude of deformation vector).
→ Biologically interpretable descriptions of ONH deformation in case of glaucoma
Statistical deformation modelling of ONH provides
Deformation based morphometry of ONH shows a potential to be a future technique to gain novel insights into glaucomatous changes of the ONH.